> with(stats[fit]);
![]()
> R(0) := 0.02925;
![]()
> R(t0):=0.02925;
![]()
> R(t1):=0.029;
![]()
> R(t2):=0.02875;
![]()
> R(t3):=0.0285;
![]()
> R(t4):=0.02785;
![]()
> R(t5):=0.0274;
![]()
> R(t6):=0.0271;
![]()
> R(t7):=0.02635;
![]()
> R(t8):=0.02615;
![]()
> R(t9):=0.0255;
![]()
> R(t10):=0.025;
![]()
> R(t11):=0.02425;
![]()
> R(t12):=0.02375;
![]()
> R(t13):=0.0232;
![]()
> R(t14):=0.0225;
![]()
> R(t15):=0.02175;
![]()
> R(t16):=0.02085;
![]()
> R(t17):=0.02;
![]()
> R(t18):=0.019;
![]()
> R(t19):=0.01725;
![]()
> R(t20):=0.01545;
![]()
> R(t21):=0.01315;
![]()
> R(t22):=0.0085;
![]()
> R(t23):=0.0;
![]()
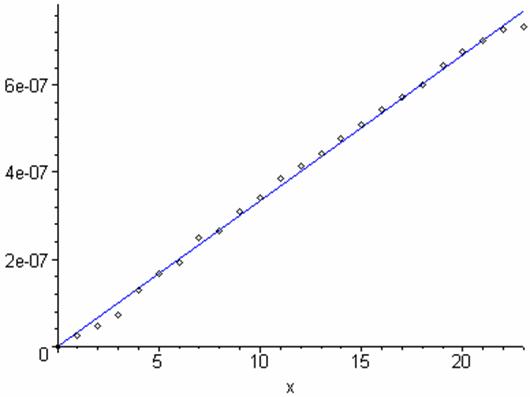
> t:=[0,1,2,3,4,5,6,7,8,9,10,11,12,13,14,15,16,17,18,19,20,21,22,23]:
> radius:=[(R(0)^(4)- R(t0)^(4)), (R(0)^(4) -R(t1)^(4)), (R(0)^(4)- R(t2)^(4)), (R(0)^(4)- R(t3)^(4)), (R(0)^(4)- R(t4)^(4)), (R(0)^(4)- R(t5)^(4)), (R(0)^(4)- R(t6)^(4)), (R(0)^(4)- R(t7)^(4)), (R(0)^(4)- R(t8)^(4)), (R(0)^(4)- R(t9)^(4)), (R(0)^(4)-R(t10)^(4)), (R(0)^(4)- R(t11)^(4)), (R(0)^(4) -R(t12)^(4)), (R(0)^(4)- R(t13)^(4)), (R(0)^(4)- R(t14)^(4)), (R(0)^(4)- R(t15)^(4)), (R(0)^(4)- R(t16)^(4)), (R(0)^(4)- R(t17)^(4)), (R(0)^(4)- R(t18)^(4)), (R(0)^(4)- R(t19)^(4)), (R(0)^(4)- R(t20)^(4)), (R(0)^(4)-R(t21)^(4)), (R(0)^(4)- R(t22)^(4)), (R(0)^(4) -R(t23)^(4))]:
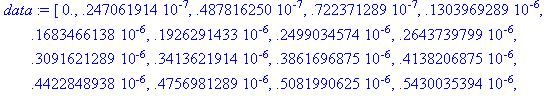
> data:= eval(radius);
![]()
> with(stats):
Warning, these names have been redefined: anova, describe, fit, importdata, random, statevalf, statplots, transform
> with(plots):
> with(fit):
Warning, the names leastmediansquare and leastsquare have been redefined
> points:=pointplot(zip((x,y)->[x,y],t, data)):
> eq:=leastsquare[[x,y],y=a*x,{a}]([t, data]);
![]()
> curve:=plot(rhs(eq),x=0..23,color= blue):
> display([points,curve]);
> restart;
> Surf_Tension:= 4*m*mu*L/(a^4);
![]()
> sigma := eval(Surf_Tension,[L = .305, mu = 1.7*10^(-5),a =.1981200000e-2, m = .3346448815e-7]);
![]()
> restart;
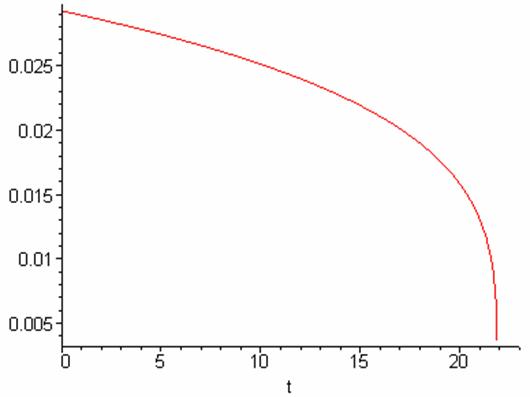
> R:=t->( Ro^4 - (sigma*a^4)*t/(4*mu*L))^(1/4);
![]()
> radius_vs_time:= eval(R(t), [L = .305, mu = 1.7*10^(-5),a =.1981200000e-2, Ro=.2925e-1, sigma=.4504843020e-1]);
![]()
> plot( radius_vs_time, t=0..23);
>