 .
.Torricelli's Law and Fluid
Dynamics
MATH 2413 Research Project 2002
Home | Representation | Analysis | Experimentation | Comparison | Extension | Presentation
Comparison
Experiment 1
Pipe BB drains in 13.3 seconds.
Pipe BS drains in 50.4 seconds.
Pipe SB drains in 3.8 seconds.
Pipe SS drains in 13.1 seconds.
According to the Analysis section, .
Using that information:
Pipe BB should drain in 14.4 seconds (7.6% error).
Pipe BS should drain in 59.4 seconds (15.2% error).
Pipe SB should drain in 3.7 seconds (2.7% error).
Pipe SS should drain in 14.5 seconds (9.7% error).
Except for Pipe SB, all pipe drain times
were shorter than expected. We anticipate that a higher value of alpha should
have been used.
Experiment 2
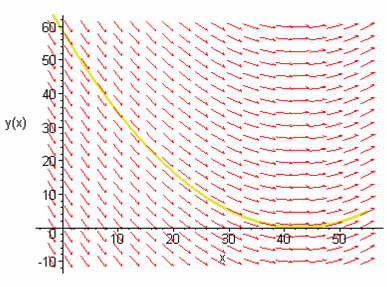
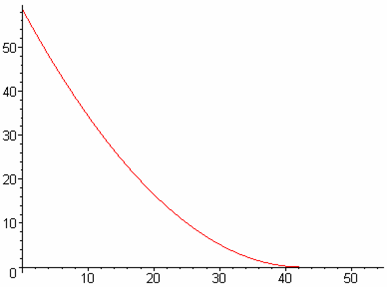
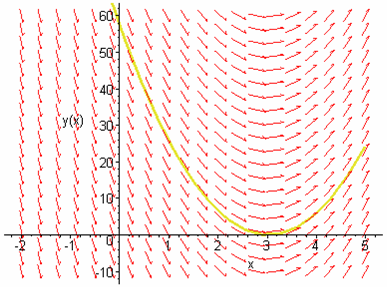
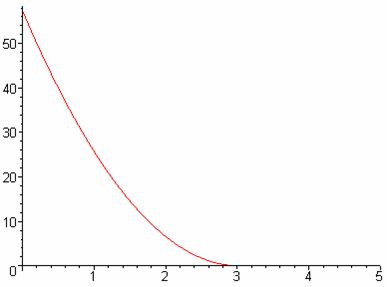
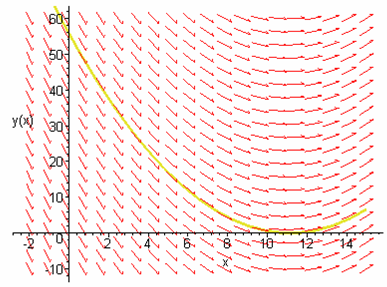
We see that the data is linear; that is, each equation is of the form v(t) = -bt + a. We use this to verify Torricelli's Law. Recall from the Analysis page:
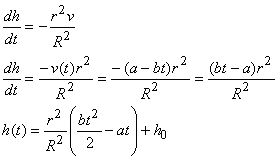
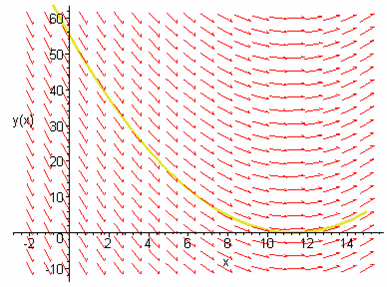
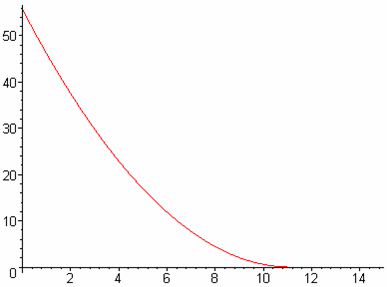
Using our known values for a and b, we can examine the slope
fields (from dh/dt) and the graphs of h(t)
from the equations above. Note that they are essentially identical. Note that
the slope fields should stop when they hit 0.
![]()
![]()
![]()
![]()
We now continue to examine our equation for h(t) to prove
Torricelli's Law by reinserting v:
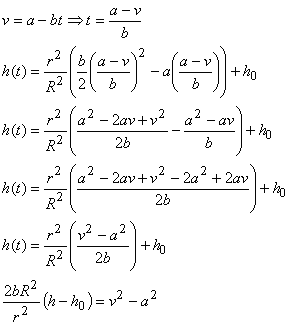
We now point out that when v = 0, h = 0:
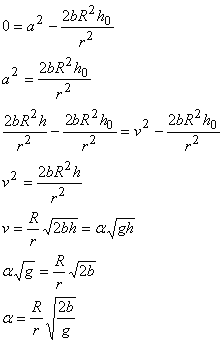
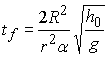
Torricelli's Law is derived here for a specific value of alpha. Given the data
for this experiment:
Pipe BB 1.07
Pipe BS 1.17
Pipe SB 1.02
Pipe SS 1.09
Average 1.08
This will be the value for alpha used in all following experiments. It is higher
than the predicted value of 0.84.
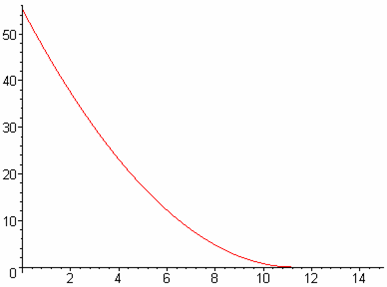
A comparison of the experimental h(t)
graphs to the theoretical h(t)
graphs (in order of BB, BS, SB, SS):
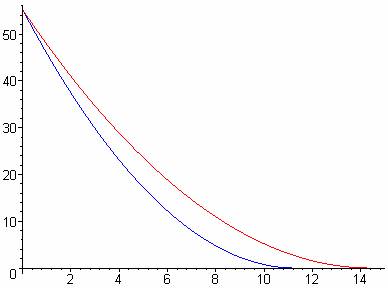
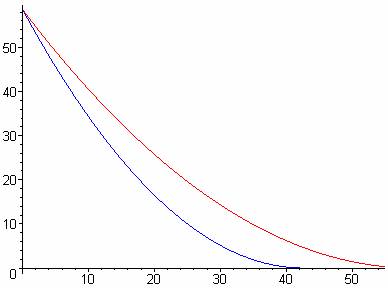
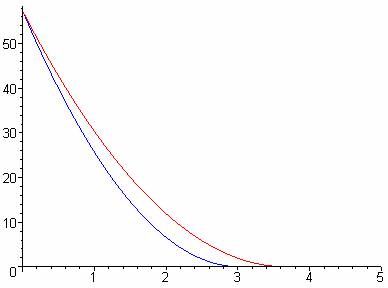
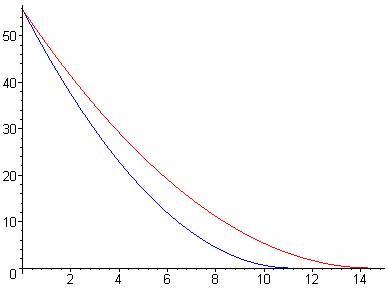
We note that the experimental data is always lower, which can be accounted for
by the theoretical alpha value of 0.84, lower than the value found through experimentation.
![]()
![]()